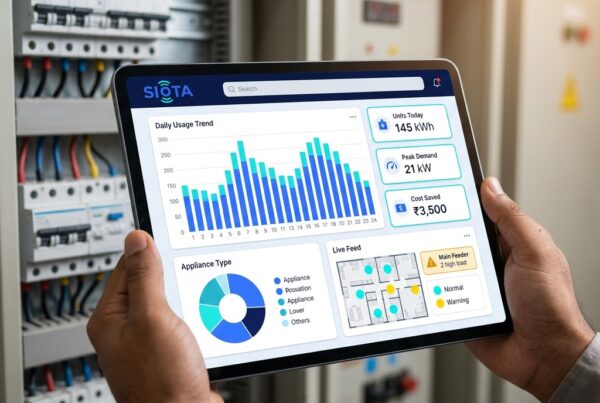
Stop Guessing Start Managing Energy in Real Time. Most facilities still rely on manual meter readings, month-end bills, and spreadsheets. By the time you spot a problem—you’ve already paid for it. SIOTA’s IoT-based Energy Monitoring Dashboard changes that. Get live visibility into every unit consumed, every machine load, and every rupee spent—across one facility or fifty.
Your electricity bill arrives every month. Can anyone in your building explain where the money went?
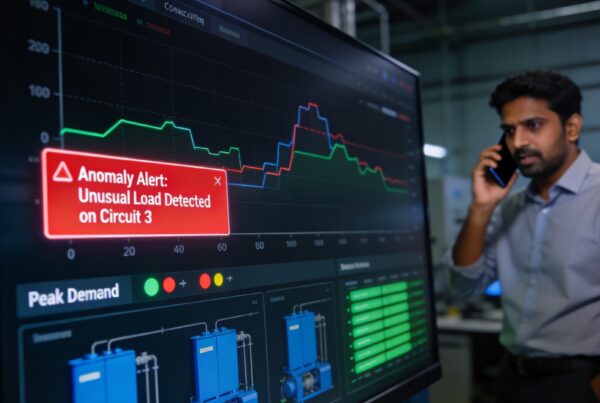
Most commercial facilities in India still manage energy from the monthly statement. By the time the problem shows up on the bill, you’ve already paid for it.
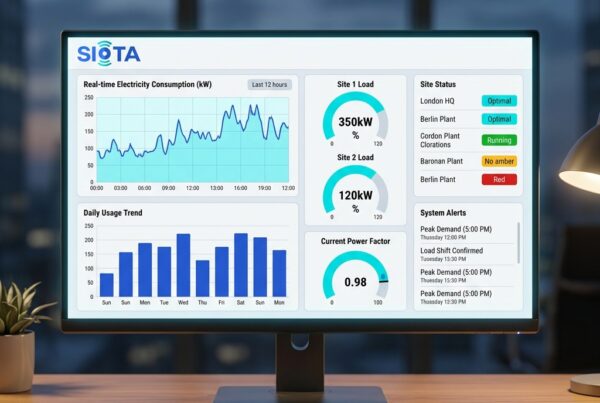
SIOTA’s IoT-based Energy Management System gives you live visibility into every unit consumed — at the meter, equipment, and location level — from a single cloud dashboard, accessible from anywhere.
No civil work. No shutdowns. Live in under 48 hours.