
We’ll Be Honest — Most Factories Are Flying Blind on Energy
Here’s something most factory owners don’t want to admit: they have no real idea where their electricity is actually going.
They get a bill at the end of the month. It’s always higher than expected. Someone blames the compressors. Someone else blames the HVAC. Maintenance says it was the weekend shift. And nothing actually changes.
This is the reality in most Indian manufacturing facilities right now — not because the people running them aren’t smart, but because they genuinely don’t have the right data in front of them.
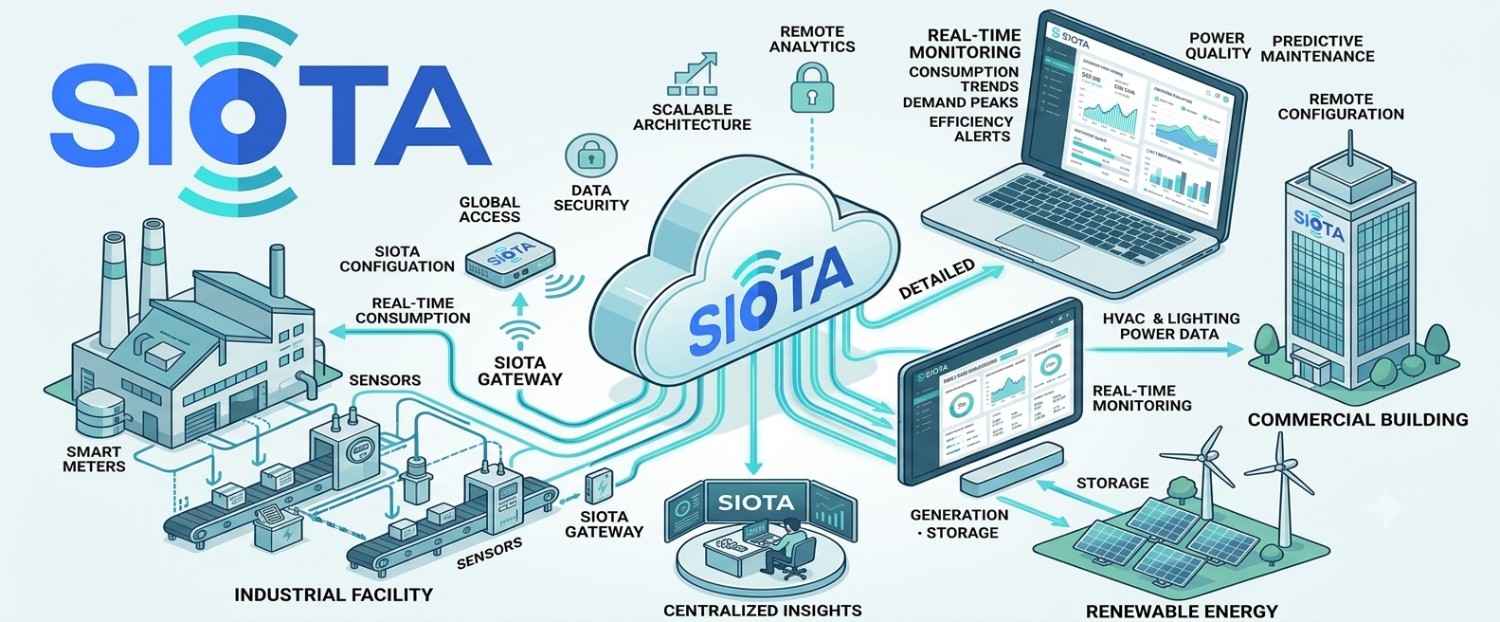
A cloud based energy monitoring system for factories fixes exactly this. It connects to your existing machines, meters, DG sets, and HVAC units, pulls live data every few seconds, and puts it all on one screen you can open from your phone at 11pm if needed. No estimates. No guesswork. No waiting for the monthly bill to figure out something went wrong three weeks ago.
This guide is written for factory managers, plant heads, and facility teams who are tired of reactive energy management and want to understand what a modern cloud monitoring setup actually looks like — the real benefits, the real limitations, and what to check before signing anything.
SIOTA Technologies has deployed these systems across factories, hospitals, hotels, and commercial buildings across India. What follows draws directly from that experience.
What a Cloud Based Energy Monitoring System for Factories Actually Does
Let’s skip the buzzwords for a minute.
At its core, a cloud based energy monitoring system for factories does three things: it collects data from your electrical equipment, sends that data to the cloud, and gives you a dashboard where you can see what’s happening — right now, not tomorrow morning.
The hardware part is simpler than most people expect. Wireless sensors clip onto your existing meters and panels. There’s no drilling, no rewiring, no production shutdown. In most factories, the hardware installation is done in a single day.
After that, the sensors start talking to the cloud. Every few seconds, they’re sending readings — current draw, voltage, power factor, load patterns — all of it tagged to the specific machine or circuit it came from.
What You Can Actually See
Once your factory is connected, the dashboard shows you things like:
- Which machine is consuming the most power right now
- How energy usage compares across shifts — day, evening, night
- Whether a motor is drawing more current than it normally should (usually a sign it’s failing)
- Whether your HVAC kept running at midnight when the floor was empty
- How your power factor is trending and whether you’re heading toward a utility penalty
Most factory managers who see this for the first time are genuinely surprised. Not because the technology is flashy. Because the data reveals problems they’ve been paying for without knowing it.
The Cloud Part Matters More Than You’d Think
Early energy monitoring systems stored data on-site. That sounds fine until your server room floods, someone accidentally resets the gateway, or your IT team leaves and nobody knows the password.
Cloud storage means your historical data is safe, accessible from anywhere, and doesn’t depend on your on-site infrastructure being healthy. It also means your team in the Delhi office can pull up energy reports for the Pune plant without calling anyone.
For multi-location factory groups, this alone is worth the investment.
Why This Is Becoming Urgent for Indian Factories Right Now
A few years ago, cloud energy monitoring was a “nice to have.” Today, there are three hard reasons why it’s becoming essential — and they’re only getting stronger.
Power Costs Have Stopped Being Predictable
Industrial electricity tariffs have been climbing steadily. But it’s not just the per-unit rate. It’s demand charges, power factor penalties, time-of-day surcharges, and contract demand overruns. Most factory billing teams are working with monthly aggregate figures that hide all of this detail.
A live monitoring system breaks the bill down to its real components. You can see exactly which load is driving your demand charge, catch power factor drops before they hit the penalty threshold, and identify whether shifting certain processes to off-peak hours would actually move the needle.
For a factory spending ₹20–30 lakh a month on electricity, even a 12% reduction is serious money.
BRSR Reporting Is No Longer Optional for Many Manufacturers
SEBI’s Business Responsibility and Sustainability Reporting (BRSR) framework has changed the compliance landscape. Large listed companies are required to report real energy and carbon data. And their suppliers — even unlisted manufacturers — are increasingly being asked to provide the same.
The problem with manual reporting is that auditors are getting better at spotting estimated data. If your ESG report shows suspiciously round numbers or month-on-month figures that don’t vary at all, that’s a red flag.
A cloud energy monitoring platform logs everything automatically — timestamps, meter-level readings, anomalies — and generates audit-ready reports at the click of a button. Real data. Real compliance.
Your Machines Are Telling You When They’re About to Break Down — But Nobody Is Listening
This one is underappreciated. Energy consumption patterns are one of the earliest warning signs of mechanical failure.
A motor that’s starting to fail draws more current. A compressor with a refrigerant leak runs longer cycles. A pump with a worn impeller shows unusual load spikes. All of this shows up in energy data weeks before the machine actually trips — if you’re looking at the data.
Most factories aren’t. They wait until something breaks, then pay for emergency repairs, rush orders, and lost production hours. A cloud based energy monitoring system turns that around. You get an alert when a machine starts behaving abnormally, you investigate before it fails, and your maintenance team works on a schedule instead of in a panic.
The Features That Actually Matter (And the Ones That Just Sound Good)
There’s a lot of marketing language floating around energy monitoring. Here’s how to cut through it.
Machine-Level Sub-Metering — Non-Negotiable
If a system only gives you facility-level data, it’s not much better than reading your main meter. You need to know which machine, which line, which shift.
Sub-metering at the machine or department level is what makes the data actionable. When you can see that Machine 4 in Line 2 consumed 18% more energy this week than last week, you have something to investigate. Facility-level data just tells you the total went up.
Alerts That Actually Reach Someone
An alert that lands in an email inbox that nobody checks is not an alert. Before you sign anything, understand how the alert system works — SMS, WhatsApp, app notification — and whether it can route different alerts to different people. Your electrical team shouldn’t be getting maintenance alerts. Your maintenance team shouldn’t be drowning in billing reports.
Good systems let you customize who gets what, with what urgency. That flexibility matters on a real factory floor.
Shift-Wise Reporting
This seems obvious but a surprising number of systems make it harder than it should be. You need to be able to pull a report that compares energy consumption across your three shifts — same day, same week, over time. This is how you find whether one shift is consistently over-consuming, whether weekend operators leave machines running, or whether the afternoon crew is actually more efficient than everyone assumes.
Works With What You Already Have
A vendor who tells you that you need to replace your existing meters, or your HVAC controller, or your electrical panels — walk away. Modern cloud monitoring systems clip onto your existing infrastructure. They read from existing meters using standard protocols (Modbus, RS485, MQTT). They don’t care what brand your HVAC is.
SIOTA works with virtually any existing setup — split ACs, cassette units, VRF systems, duct ACs, DG sets from any brand, and standard energy meters. Nothing gets ripped out.
How SIOTA Specifically Handles Factory Energy Monitoring
SIOTA isn’t a generic IoT platform. It was built around the specific problems Indian facilities face — variable load profiles, aging infrastructure, multi-shift operations, compliance pressures, and the need for systems that work without a dedicated IT team babysitting them.
Here’s what the setup actually looks like for a factory.
What Gets Connected
Your electrical distribution boards and sub-meters. Sensors are installed on the panels feeding your key production lines, utilities, HVAC banks, and general lighting. This gives you department-level and machine-level consumption without touching your production equipment.
Your DG sets. SIOTA monitors fuel levels, runtime hours, load patterns, and performance metrics. This matters because DG misuse — whether accidental or intentional — is a significant cost centre in many factories. Automated alerts catch it immediately.
Your HVAC systems. Rather than letting HVAC run on timers or manual switching, SIOTA automates control based on occupancy and temperature readings. Factories typically cut HVAC energy by 10–20% from this alone, often without anyone noticing any change in comfort.
Critical machines. For equipment where downtime is expensive, additional sensors track current draw, temperature, and vibration trends. Deviations from normal operating patterns trigger alerts before failures occur.
What the Dashboard Looks Like in Practice
The SIOTA dashboard is built for people who aren’t data scientists. Your plant manager can look at it in the morning and immediately see whether last night’s shift was normal. There are no 14-tab Excel spreadsheets to interpret. If something is wrong, it shows up in red. If everything is running as expected, it shows up in green.
Reports for ESG and BRSR are generated with one click. You don’t need to involve your accounts team or your data entry staff. The system logs everything automatically.
Getting Started Is Faster Than Most People Expect
The full deployment process — sensors installed, cloud connected, dashboard live, team trained — typically takes 48 hours. That’s not a marketing claim. It’s because the installation is wireless and non-intrusive. There’s no civil work. No factory downtime.
SIOTA sends engineers to your site, installs the hardware, configures your dashboard, and walks your team through how to use it. From there, a dedicated engineer stays available for support. You’re not handed a manual and left to figure it out.
What Factories Are Actually Saving — Real Numbers
The most common question is: what’s the ROI?
It genuinely varies. A factory that’s already done significant energy optimization won’t see the same gains as one running on manual monitoring and decade-old practices. But based on real deployments across Indian manufacturing facilities, here’s a realistic picture:
| What Gets Fixed | Typical Savings |
|---|---|
| Idle machine loads eliminated | 5–10% of total consumption |
| HVAC runtime optimized | 10–20% of cooling costs |
| Power factor penalty avoided | Depends on current penalty, often ₹50,000–₹3 lakh/month |
| Demand charge management | 5–8% of total bill |
| Predictive maintenance (avoided breakdowns) | Variable, often larger than energy savings |
For a factory with a ₹25 lakh monthly electricity bill, achieving even a 15% combined reduction saves ₹3.75 lakh every month. The system pays for itself — hardware, installation, and subscription combined — typically within 6 to 12 months.
And unlike a one-time audit, the savings compound. The system keeps watching. It catches new problems as they develop. It doesn’t retire after the first finding.
What to Check Before You Buy Any Cloud Energy Monitoring System
If you’re evaluating vendors beyond SIOTA, here are the questions that actually matter.
Does it work with your existing equipment? Get a specific answer, not “it integrates with most systems.” Ask: will it read from my existing meters? Will it connect to my specific HVAC brand? If they need a site visit before they can answer this, that’s fine. If they say yes to everything without asking a single question about your setup, be cautious.
Who owns the data? Your energy data is sensitive. Some platforms retain rights to aggregate or use your data. Read the agreement carefully. You should own your data outright.
What happens if the internet goes down? A good system buffers data locally and syncs when connectivity is restored. You shouldn’t lose historical readings because of a network hiccup.
What does support actually look like after deployment? Ask for a clear answer: who do you call when something isn’t working? Is there a dedicated contact or a generic helpdesk? Response time commitments matter in a factory environment where a monitoring gap has real consequences.
Can it scale? If you have three plants today and six in two years, does the system scale with you without a complete re-implementation?
Frequently Asked Questions
I already have energy meters in my factory. Why do I need a cloud system on top of that?
Standard meters give you totals. They don’t tell you which machine drove that total, which shift consumed the most, or whether the number is trending in the wrong direction. A cloud monitoring system adds real-time visibility, machine-level breakdown, trend analysis, and automated alerts — none of which a standalone meter can provide.
Will installation disrupt production?
No. Wireless sensor installation is non-intrusive. Engineers work around your production schedule. In most factories, installation happens without any production downtime.
How much does it cost?
Pricing depends on the number of monitoring points, the complexity of your setup, and the features you need. SIOTA offers a free site assessment and will give you a transparent quote with no hidden charges. The pilot program currently offers priority onboarding with preferential pricing locked for two years.
What if my operators aren’t comfortable with technology?
The dashboard is intentionally simple. It’s designed for facility managers and floor supervisors, not IT professionals. SIOTA provides hands-on training for your team before handing over. Most operators are comfortable using the system within a day.
Can I see data from multiple factories in one place?
Yes. Multi-location management is one of the core use cases SIOTA is built for. You can view, compare, and report across all your facilities from a single dashboard.
Is cloud storage secure for factory operational data?
SIOTA uses encrypted data transmission and secure cloud storage with role-based access controls. Your operational data is accessible only to people you authorize. This is standard practice for industrial IoT platforms operating in India.
What’s the difference between energy monitoring and energy management?
Monitoring shows you what’s happening. Management does something about it — automatically controlling equipment based on what the data shows. SIOTA offers both: you can start with monitoring and add automated control features like HVAC scheduling and occupancy-based load management as you go.
How do I know if the savings are real and not just seasonal variation?
The dashboard shows baseline comparisons, weather-adjusted benchmarks, and trend analysis over time. You’re always comparing against your own historical data, not an industry average. So when savings show up, you can trace them directly to specific actions.
What IoT protocols does the system use?
Modbus, RS485, MQTT, and BACnet are all supported. These are the standard industrial protocols that work with the vast majority of factory equipment, meters, and HVAC systems in use across India.
We’re a mid-sized factory. Is this only for large enterprises?
Not at all. SIOTA works with facilities of all sizes — from single-plant manufacturers to multi-location industrial groups. The system scales to match your setup, and the ROI math works just as well for a factory spending ₹8 lakh a month on electricity as it does for one spending ₹80 lakh.
If You’ve Read This Far, You Already Know What to Do Next
Most factory teams who reach this point of the conversation know, somewhere in the back of their minds, that they’ve been managing energy the hard way for too long.
The monthly bill arrives. Someone makes a note. Nothing changes until the next bill arrives. Maintenance happens when machines break, not before. ESG reports get filled in with estimates because nobody has the real data.
A cloud based energy monitoring system for factories doesn’t require a massive infrastructure overhaul or a new IT team. It clips onto what you already have, goes live in 48 hours, and starts showing you things you’ve never been able to see before.
SIOTA is currently running a pilot program for 10 Indian factories. Priority onboarding. Dedicated engineer. Pricing locked for two years.
