

Nobody sets out to waste energy. But most Indian industrial facilities do — quietly, consistently, month after month — because they simply can’t see what’s happening until the bill arrives.
That gap between “what’s happening right now” and “what the bill says happened” is exactly where a real time energy monitoring system with dashboard sits. It closes that gap. Not partially. Completely.
I want to be upfront about something before we go further: this isn’t a concept article. This is a practical breakdown of how these systems work in actual Indian industrial settings — the messy, fluctuating-voltage, dusty-switchroom reality — and what you should actually care about when evaluating one. Siota (siota.in) builds this technology for Indian businesses, and their approach is worth understanding in detail.
But first, let’s talk about why you’re here.
The Problem Isn’t Your Electricity Bill. It’s That You Only See It Once a Month.
Think about how you currently manage energy at your facility.
Something consumes more power than it should. Maybe a motor is wearing out and drawing extra current. Maybe a compressor runs through a weekend shutdown because nobody added it to the checklist. Maybe your power factor dips every afternoon because your capacitor bank scheduling is based on a load profile from three years ago.
None of this is visible to you until the DISCOM sends a bill. And by then, you’ve already paid for it.
A real time energy monitoring system with dashboard doesn’t change your tariff structure or negotiate with your DISCOM. What it does is shrink the lag between “problem starts” and “you find out about it” from 30 days to about 30 seconds.
That’s not a small thing. At industrial scale, 30 seconds versus 30 days is the difference between a corrective action that costs nothing and a billing surprise that costs ₹40,000.
Why monthly bills are structurally useless for facility management
Your electricity bill tells you total consumption, maximum demand recorded, power factor average, and a final number you’re supposed to pay. It does not tell you:
Which machine caused the demand peak on the 14th between 11:15 and 11:30 AM. Whether your chiller was running during Sunday’s shutdown. Why your power factor was fine for three weeks and then dropped. Whether your actual load pattern still matches the sanctioned load you contracted for five years ago.
All of that requires granular, timestamped data that a meter reading simply doesn’t provide. That’s the data a real time monitoring dashboard gives you.
What the System Actually Consists Of (Without the Marketing Language)
Here’s the honest version.
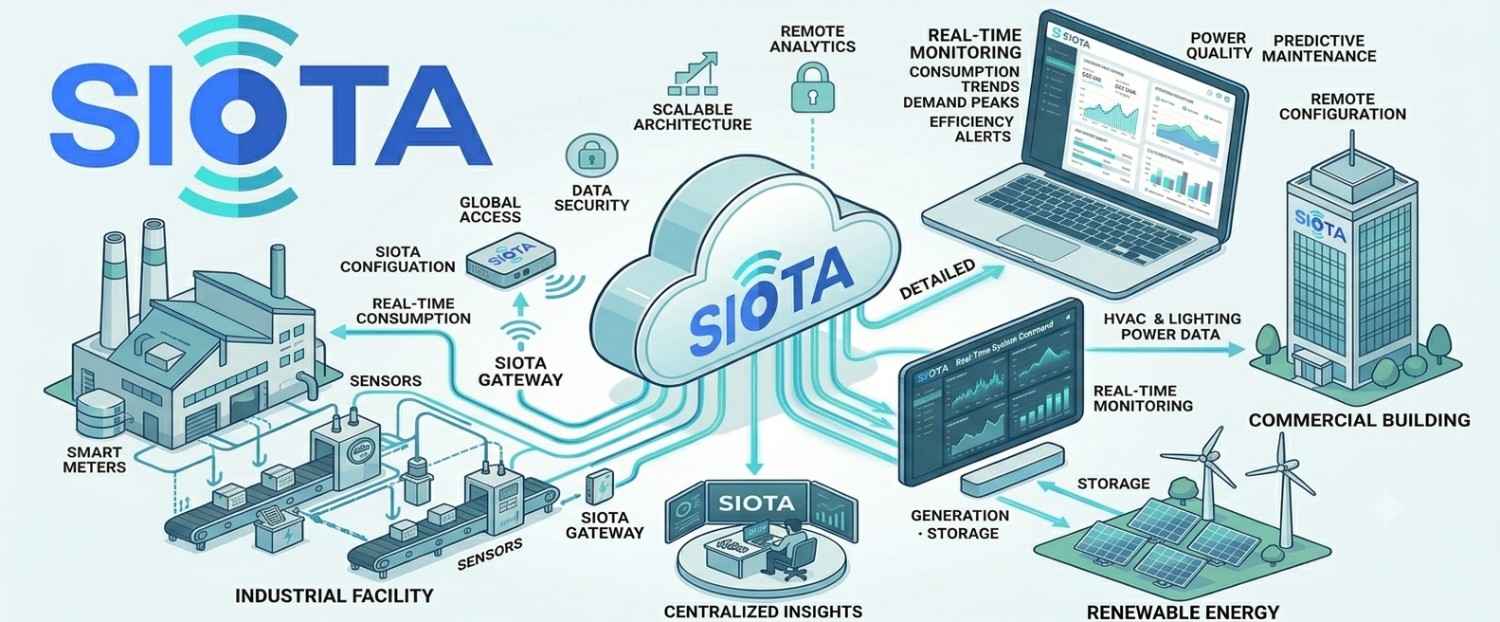
Smart meters or current transformer sensors go on your cables — at your main incomer, your feeder panels, your critical machines, wherever you want visibility. These aren’t complicated devices. They measure current, voltage, power factor, frequency, and kilowatt-hours, and they do it continuously.
That data gets sent to a cloud server. How it gets there depends on your site — Wi-Fi if your signal is reliable and your facility isn’t a concrete maze, 4G SIM if it is. Ethernet if you have the infrastructure and want zero communication gaps.
The cloud server processes the raw data and presents it through a dashboard — a web interface you access on a browser or phone. The dashboard shows live consumption, historical trends, equipment-level breakdowns, and alerts when something crosses a threshold you’ve defined.
That’s it. That’s the whole system.
Where different platforms actually diverge
The hardware components are similar across most serious vendors. What varies is everything around the hardware.
How configurable are the alerts? Can you set a rule that says “if the injection moulding machine draws more than 40 kW for more than 12 minutes during a non-production window, SMS the maintenance supervisor immediately” — or do you get a generic “high consumption” notification that you eventually start ignoring?
How is historical data stored? Is full-resolution data retained for 12+ months, or does the system compress older data into hourly averages that hide the patterns you need for audit and trend work?
What does the dashboard actually look like to someone who isn’t an electrical engineer? If your operations manager opens it and immediately feels like they need a training course, the system will be under-used within three months.
Siota’s platform handles all three of these well. The alert logic is genuinely configurable at the individual meter level. Data retention doesn’t compress or degrade over time. And the dashboard is designed for the person who manages production, not the person who designed the electrical installation.
The Three Numbers on Your Bill That Real Time Monitoring Directly Affects
Not every electrical parameter matters equally to your bottom line. For most industrial consumers in India, three numbers drive the majority of your bill — and two of them are things most plant managers don’t watch closely enough.
Maximum demand — the one that surprises people most
Your DISCOM doesn’t just charge you for the units you consume. They charge you for the highest 15-minute average demand you recorded in the entire billing month. One bad window — three large motors starting simultaneously, an air compressor kicking in while the welding line is running full tilt — and your demand charge for the whole month is set by that single 15-minute peak.
With live monitoring, your team sees demand climbing in real time. You can stagger motor startups by 10 or 15 minutes. You can reschedule your highest-load operations away from the hours when other equipment is already running near capacity. This single change, done consistently, typically cuts demand charges by 15 to 25 percent. On a ₹5 lakh monthly bill, that’s ₹75,000 to ₹1.25 lakhs a year — found entirely through operational changes, not capital investment.
Power factor — the quiet penalty most facilities are paying
Power factor is a measure of how efficiently your equipment uses the electricity it draws. Below 0.90, most DISCOMs in India apply monthly penalties. Some facilities run at 0.78, 0.80 — and they’ve been paying power factor surcharges for years without a clear picture of when and why it’s happening.
Capacitor banks are supposed to fix this. And they do, when they’re switched correctly based on actual load conditions. The problem is that most facilities run their capacitor banks on a fixed schedule — on at 8 AM, off at 6 PM — regardless of what the actual load is doing. If your load drops at 2 PM or spikes in a way the schedule doesn’t account for, your power factor drifts and you pay for it.
A live dashboard shows real time power factor readings. Your electrical team can see exactly when switching is needed. It’s a simple operational change that typically eliminates power factor penalties entirely within the first billing cycle.
Sanctioned load versus actual consumption pattern
This one is less discussed but worth paying attention to. Many facilities are running on contracted loads that were negotiated years ago and no longer match actual operations — either because production has expanded, or because it’s contracted higher than needed. Real time data tells you what your actual load profile looks like across different times and seasons, which gives you the information to renegotiate your contracted load intelligently if it makes sense.
How Deployment Actually Works — And Where Things Go Wrong
Sales conversations about deployment make it sound frictionless. The reality is more nuanced.
The assessment phase is the most important and the most underinvested. Before a single sensor goes in, someone needs to map your electrical distribution — not just the single-line diagram from the panel room, but the actual physical layout, what’s connected where, which circuits share a feeder, where communication signals will be reliable. Skipping this, or doing it too quickly, results in monitoring points that give you misleading data or gaps in coverage you don’t discover until three months later.
Installation itself is genuinely non-disruptive for most setups. Clamp-type CT sensors go around existing cables without touching live conductors. Communication gateways mount in available panel space. Most facilities are live within a day or two without stopping production.
Configuration is where the investment in time pays off later. Setting up machine names that match what your team actually calls things. Defining alert thresholds based on real operating data, not default values. Establishing who gets notified about what — because sending every alert to everyone is a fast path to people ignoring all alerts.
The first two to three weeks of live data are usually the most revelatory. You will see things you had no idea were happening. Machines running during scheduled shutdowns. Consumption patterns that don’t match production schedules. Equipment whose energy draw is trending up in a way that suggests a developing mechanical fault.
The facilities that get the most value from these systems are almost always the ones that designate someone internally to own the energy data — to look at it regularly, act on what they see, and bring the insights into operational decisions. The monitoring system gives you the information. What you do with it is still a human job.
Realistic Numbers: What Savings Actually Look Like
The most honest thing I can say about savings is that they vary significantly based on how much low-hanging fruit exists at your facility.
A plant that has never monitored energy before — no sub-metering, no demand management, capacitor banks on a fixed schedule — typically finds 15 to 20 percent in savings in the first year. Because there’s waste everywhere, and it was all invisible until now.
A facility that already does some level of energy management typically finds 6 to 10 percent in additional savings from real time monitoring. That’s still meaningful — on a ₹4 lakh monthly bill, 8 percent is ₹3.84 lakhs a year.
For smaller facilities with monthly bills in the ₹80,000 to ₹1.5 lakh range, payback periods of 9 to 14 months are typical. For mid-sized plants above ₹3 lakhs monthly, payback often comes in under six months when demand management opportunities are significant.
There’s also a less-talked-about category of savings: avoided breakdowns. Equipment that’s developing a fault almost always shows it in energy data first — gradually rising idle consumption, erratic load curves, power factor anomalies specific to one circuit. Catching these through energy monitoring means planned maintenance instead of emergency breakdowns, and in manufacturing, unplanned downtime is almost always more expensive than anything else.
What to Actually Ask a Vendor Before You Sign Anything
Most vendor conversations are led by the vendor. They show you the cleanest version of their dashboard, give you a payback period calculation based on optimistic assumptions, and hand you a proposal.
Here are the questions that expose whether a system is actually right for your facility:
How does your alert logic work — can I set machine-specific thresholds with time-of-day conditions, or are alerts configured at the account level with basic high/low settings?
What happens to my data if I cancel the subscription? Can I export full-resolution historical data, and in what format?
How do you handle 4G connectivity gaps — does the gateway buffer data locally and sync when connectivity returns, or do I lose data for the duration of an outage?
Have you deployed at facilities with a similar electrical layout and tariff structure to mine? Can I speak to someone at that facility?
What does your onboarding process look like after installation — is there a structured review at 30, 60, and 90 days, or does your team disappear after go-live?
The answers to these questions tell you more about a vendor’s suitability than any feature comparison sheet.
Conclusion
If you manage energy at a facility and you’re still relying on monthly bills to tell you what’s happening, you’re working with a one-month lag on information that affects your costs every day. A real time energy monitoring system with dashboard doesn’t solve every energy problem, but it removes the information gap that makes most energy problems invisible until they’re expensive.
Siota has built this for Indian industrial conditions specifically — the voltage instability, the tariff complexity, the physical environments that break systems designed for cleaner settings. It’s worth looking at seriously, particularly if you’re managing multiple sites or running a facility where maximum demand charges are a significant line item.
Visit siota.in and ask for a consultation. Tell them your monthly bill range, your industry, and your current level of metering. A good vendor will tell you honestly whether their system makes financial sense for your situation — and if they won’t tell you when it doesn’t, that itself is useful information.
Your next bill is already accumulating. The question is whether you want to see what’s driving it before or after it arrives.
FAQ
Q: What is a real time energy monitoring system with dashboard in simple terms?
It’s a combination of sensors installed at your electrical panels or machines, connected to software that shows you — right now, on a screen — how much power different parts of your facility are consuming. The “dashboard” is just the interface where all that live data is displayed in a readable format, with graphs, alerts, and historical comparisons. The key word is real time: you’re not waiting for a report or a bill. You’re seeing it as it happens.
Q: Our facility already has digital meters. Do we still need this?
Digital meters record consumption, but they typically don’t give you real time visibility, machine-level breakdown, configurable alerts, or trend analysis through a dashboard. They’re an improvement over analog meters, but they don’t close the information gap that a monitoring system closes. Whether the additional investment makes sense depends on your bill size and how much you currently lose to waste you can’t see — which is exactly what a good vendor will help you assess before you commit.
Q: How disruptive is installation for a running plant?
Less disruptive than most people expect. Modern IoT energy monitoring systems use non-invasive current transformers that clamp onto existing cables without disconnecting anything. The actual installation work happens at your panels and doesn’t require production to stop. Most facilities are fully live within 24 to 48 hours of the installation team arriving on site.
Q: We have plants in three different states with different DISCOMs and tariff structures. Can one system handle all of them?
Yes, and this is one of the stronger use cases for cloud-based monitoring platforms. Siota’s multi-site dashboard lets you monitor all locations under a single login. Each site’s data is displayed according to its own parameters, and you can compare performance across sites or drill into any individual facility. The tariff structures being different doesn’t affect the monitoring — it just means your cost calculations and alert thresholds will be configured differently for each location.
Q: What’s a realistic payback period for a medium-sized manufacturing unit?
For a facility with a monthly electricity bill between ₹2 and ₹5 lakhs, payback periods of 8 to 14 months are typical — assuming the team actually uses the system to make operational changes. The monitoring system finds the opportunities; the savings come from acting on them. Demand charge management and power factor correction together usually account for the majority of early savings, followed by waste elimination from identifying equipment that runs unnecessarily during non-production hours.
Q: What happens to our energy data if we decide to stop using the platform?
This is a question worth asking explicitly before you sign with any vendor. Good platforms allow you to export your full historical data in standard formats (Excel, CSV) at any time, including if you cancel. Some platforms make data export difficult or charge for it. Clarify this upfront, particularly if you anticipate needing historical data for BEE audits, ISO 50001 certification, or internal reporting.
Q: Does this help with BEE compliance?
Yes, significantly. The Bureau of Energy Efficiency requires designated consumers to maintain energy consumption records, conduct periodic audits, and demonstrate energy performance improvements. A real time monitoring system with dashboard generates exactly the kind of granular, timestamped consumption data that makes BEE compliance documentation straightforward rather than a manual exercise pieced together from meter readings and spreadsheets.
Q: We’ve looked at energy monitoring before and it seemed expensive. Has the cost come down?
Substantially, yes. IoT hardware costs have dropped considerably over the last five to six years, and cloud-based software delivery has replaced expensive on-premise server installations. For most medium-sized facilities, the total investment — hardware, installation, and first-year subscription — is now in a range where the first year’s savings more than cover it. The economics look different than they did even three years ago.
