

Walk into most Indian warehouses and ask about temperature, and someone will point at a thermometer near the office cabin. It reads fine. Meanwhile, forty feet up near the metal roof, the air is a different season altogether — and the cartons stacked on the top racks have been sitting in it all afternoon. An iot temperature monitoring system exists because one thermometer by the office is not monitoring; it is decoration. Real monitoring means sensors where the stock actually sits, readings through the night, and an alert before the heat does its damage.
This guide is written for warehouse managers, 3PL operators, and supply-chain heads running storage in India — pharma godowns, food and dairy cold stores, FMCG distribution centres, retail back-end warehouses. It covers how an IoT temperature monitoring system maps a warehouse, where the hot spots hide, what happens on nights and weekends, and how multi-site operators watch every location from one screen. If your stock is sensitive to heat, this is the practical handbook.
How an iot temperature monitoring system sees your warehouse
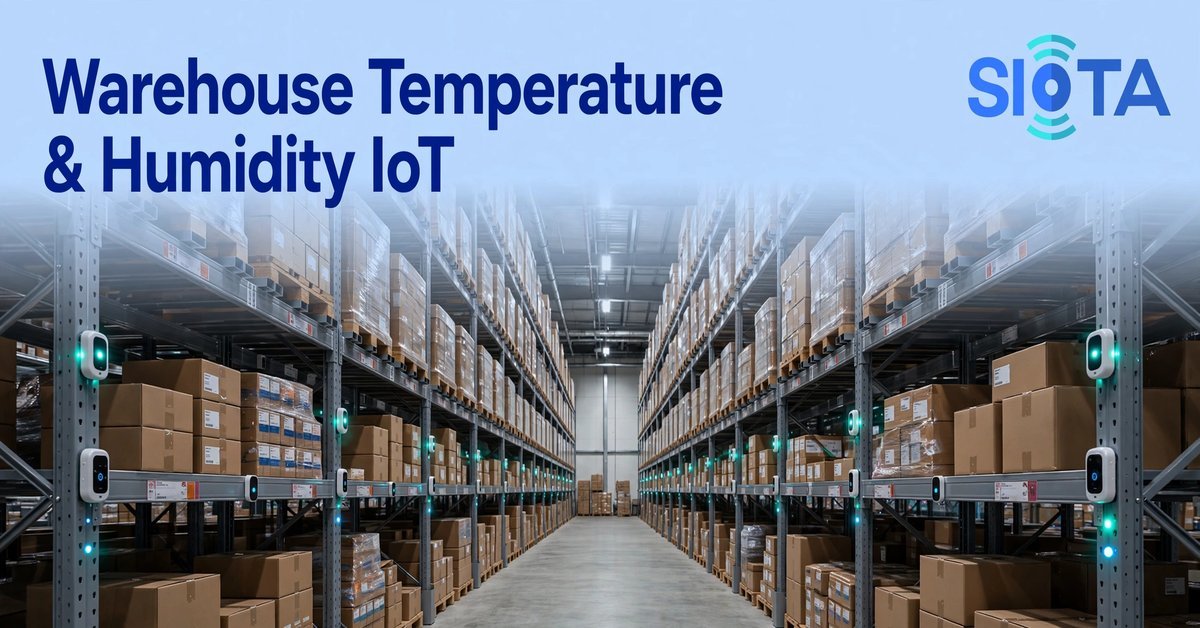
Forget the single thermometer. A proper IoT temperature monitoring system places a grid of small wireless sensors across the warehouse — near the roof, at mid-rack height, at floor level, by the dock doors, and inside any cold rooms or insulated zones. Each sensor reports temperature and humidity every few minutes to a gateway, and the dashboard builds a living map of the building’s climate. You stop guessing what the warehouse “feels like” and start seeing it, zone by zone, hour by hour.
The first revelation is almost always the vertical gradient. Hot air rises, and under an Indian metal roof in May, the top of a rack can run dramatically warmer than the floor — the same warehouse, two different climates stacked on top of each other. Goods stored high suffer silently while the office thermometer reports a comfortable number. The sensor grid makes this visible in a single glance, and suddenly the decision of what to store where stops being habit and starts being evidence.
The second revelation is time. Warehouses breathe through the day: cool at dawn, climbing through the afternoon, holding heat into the evening. Dock doors open for dispatches, forklifts stir the air, the sun hits the west wall. An IoT temperature monitoring system records all of it, so when a client asks what happened to their consignment on a particular Tuesday, you have an answer with timestamps instead of a shrug. That record is becoming the price of doing business with serious clients.
Mapping studies: finding the hot spots before they cost you
Before any permanent installation, serious operators run a mapping study — a week or two of dense sensor coverage whose only job is to find where the warehouse lies to you. The sensors go everywhere, including the spots nobody thinks about: the corner behind the racking, the strip along the west wall, the area above the dock levellers. An iot based temperature and humidity monitoring system for warehouse deployments usually begin this way, because the map decides everything that follows — how many permanent sensors you need and exactly where they earn their keep.
What the map typically finds is a short list of usual suspects. The dock door zone swings wildly with every opening. The top racks near the roof run hot all afternoon. One corner stays oddly warm because a neighbouring wall catches the evening sun. A cold room’s far corner lags the rest during pull-down. None of this is visible to a walkaround with a handheld meter at 11 am, which is why the week-long map keeps surprising even experienced warehouse managers. The building has a climate; the map is the first time anyone has seen it.
After mapping, the permanent sensor layout practically designs itself: sensors stay in the worst spots, a few cover the representative zones, and the dock doors get their own watch. Re-mapping once a year — or after any layout change, new racking, or roof work — keeps the picture honest. Warehouses change; the monitoring should change with them. Operators who skip the mapping step usually end up moving sensors around for months, discovering by accident what a two-week study would have shown on day one.
Dock doors, roof heat and the 3 pm spike
If your warehouse has one chronic problem area, it is the dock. Doors open for loading, hot air pours in, the cooled zone near the cold room bleeds out, and every opening is a small excursion. The fix is not to seal the dock — business needs the doors open — but to know exactly what each opening costs in temperature terms. Sensors at the dock show the spike and the recovery time, and that data drives practical decisions: strip curtains where they help, faster loading discipline, staging sensitive consignments away from the door zone.
Roof heat is the slower, bigger enemy. An uninsulated metal roof turns the top third of the warehouse into an oven on summer afternoons, and the damage is cumulative — pharma stability, food quality, and packaging integrity all degrade with sustained heat, not just dramatic spikes. The sensor near the roof is often the most alarming tile on the IoT temperature monitoring system dashboard, and also the most useful: it justifies roof insulation, turbo ventilators, or simply moving sensitive SKUs to lower racks. Without the reading, the heat is just a feeling everyone complains about and nobody acts on.
The 3 pm spike deserves its own mention because it fools audits. A warehouse checked at 10 am looks compliant; the same warehouse at 3 pm tells a different story. Continuous monitoring catches the afternoon peak that spot-checks miss, and the daily curve becomes the honest document — showing not just that limits were held, but when the building works hardest to hold them. If your client audits are announced in advance, this curve is what keeps you honest on the unannounced days too.
Nights, weekends and power cuts: when nobody is watching
Warehouses are most vulnerable when they are empty. The night shift is thin, the weekend has a skeleton crew, and festival holidays have nobody at all — which is when power cuts hit and compressors choose to retire. An excursion starting at midnight and found at 8 am has done eight hours of damage. This is the core argument for continuous monitoring, and where an environment monitoring system iot setup proves its worth: sensors on battery backup keep recording through the outage, and the alert reaches the duty manager’s phone while there is still time to act.
Power cuts deserve special attention in Indian warehouses because they are not rare events — they are operating conditions. The question is never whether the power will trip, but what your cold chain does in the first thirty minutes after it does. Monitoring answers that question with data: the dashboard shows the temperature curve bending upward the moment cooling stops, and the alert thresholds are set so the phone rings while the stock is still safe, not after it is lost. Pair the sensors with a DG auto-start routine and you have a chain that defends itself.
Weekends need a named owner. The system can shout, but someone has to be assigned to hear it — a rotating duty roster with the escalation chain loaded into the alerting system. The warehouses that handle excursions well all have the same boring secret: everyone knew in advance whose phone would ring, what they were supposed to do, and who to call next. Technology buys you the warning; the roster buys you the response.
One dashboard for every warehouse you run
Single-site monitoring is useful; multi-site monitoring is transformative. A 3PL operator or retail chain running warehouses across cities gets one screen showing every location’s climate side by side — green tiles where all is well, amber where something is drifting, red where action is needed. The regional manager starts the day with a two-minute scan instead of a dozen phone calls, and the sites that need attention announce themselves. An IoT temperature monitoring system scaled across locations turns climate from a local worry into a centrally managed standard.
This changes how companies handle clients and contracts. When every site produces the same continuous record, promising a client “controlled storage across our network” stops being a sales line and becomes a demonstrable fact — the data from Jaipur looks like the data from Guwahati, because the standard is the same. New sites come onto the dashboard in days, and acquisitions get instrumented before the ink dries. For operators competing on reliability, that uniformity is a genuine selling point.
It also changes internal accountability, quietly but firmly. When head office can see every warehouse’s climate, the site manager who kept insisting “everything is fine here” now shares the same screen as everyone else. Good sites get recognised; struggling sites get help instead of hiding. Nobody loves being watched, but every supply-chain head loves knowing — and the warehouses that run well have nothing to fear from the dashboard.
When the alert fires: the excursion playbook
Every warehouse needs a written playbook for the moment the phone buzzes, because an alert without a plan just creates panic with better information. The playbook is simple: acknowledge the alert, check the dashboard to see which zone and how far out of range, and follow the site’s response steps — close the dock doors, check the cooling equipment, move the most sensitive stock if needed, start the DG if power is the cause. An iot temperature monitoring system gives you the early warning; the playbook turns it into a routine instead of a crisis.
The second half of the playbook is documentation. Every excursion gets a short incident note: when it started, when it was noticed, what the peak reading was, what was done, and when the zone recovered. This log is gold — for client queries, for audits, and for your own pattern-spotting. A zone that excursions every fortnight has equipment begging for maintenance; the incident log makes that visible months before the breakdown. Warehouses that document excursions improve; warehouses that just survive them repeat them.
Finally, review the alerts monthly with the whole team — not as a blame session, but as operations review. Which zones alerted most? Were the thresholds right, or did the team get woken for nothing? Did the response follow the playbook? This review is where the system gets smarter every month, and where the team builds trust in it. Monitoring that nobody reviews slowly becomes monitoring nobody believes.
Frequently asked questions
Our warehouse is not air-conditioned. Does monitoring still help?
Yes — arguably more. A non-AC warehouse swings with the weather, and that swing is exactly what you need to understand: how hot the top racks get in May, how humid the monsoon weeks are, which zones stay within your product’s limits and which do not. Monitoring does not cool the building; it tells you the truth about it, so storage decisions, client promises, and insulation investments are based on evidence. That truth is what an IoT temperature monitoring system is for.
How many sensors does a large warehouse actually need?
More than the one by the office, fewer than you fear. A typical large warehouse ends up with a grid covering roof level, mid-rack, floor level, dock doors, and any cold rooms — often a dozen or so sensors for a big site. The mapping study decides the exact number: it finds the zones that behave differently, and each distinct zone earns a sensor. Start with the map; the count follows.
We run warehouses in several cities. Can one system cover all of them?
That is exactly what these systems are built for. Each site gets its own sensors and gateway, and all of them report to one central dashboard with role-based access — the site manager sees his site, the regional head sees her region, and head office sees everything. Adding a new warehouse is a small project once the template exists: same sensor layout logic, same alert playbook, same reports.
Do the sensors survive dust, forklifts and warehouse life?
They are built for it — industrial sensors handle dust, heat, and the occasional knock far better than office equipment. Mount them out of the forklift strike zone, ideally on racking uprights or pillars above traffic height, and protect the gateway in a small enclosure. Ask the vendor about the operating temperature range and dust protection rating; the answers should match your site’s worst day, not its best.
Can the system track door-open events too?
Yes, and it should. Door sensors paired with temperature readings tell the complete story — the dock door opened at 2:15, the zone temperature started climbing at 2:20, it recovered by 3:00. That correlation turns vague complaints about “too many door openings” into specific data, and it settles the endless debate about whether the door discipline or the cooling capacity is the real problem.
How do we show compliance to clients and auditors?
Export the records. A proper system generates excursion reports, daily summaries, and continuous logs in formats auditors accept — timestamped, uneditable, covering nights and weekends. When a client asks for last month’s cold room data, you email a report instead of photocopying a register. Pharma and food clients increasingly expect this as standard; having it ready wins business.
If your stock spends its nights in a building you cannot see into, change that. Walk your warehouse at 3 pm, stand under the roof and feel what the top racks endure every summer afternoon — then imagine knowing it from your phone instead. An iot based temperature and humidity monitoring system for warehouse begins with a mapping study that reveals the building’s real climate in two weeks. To speak with the SIOTA team or hear what other warehouse operators say, find SIOTA on Google here — your stock deserves watching even when nobody is on the floor.
